Layers for PDFs in R
http://www.evanjbrunner.info/posts/layers-for-pdfs-in-r/
Published: January 10, 2013 |
useless personal anecdote re: why layers
tldr
R: an implementation of the S language
My fianceé was recently working on her thesis (a survey of Crangon crangon in the Westfjords) and wanted to use R do do some statistical analysis, [and / or] some spatial mapping.
Once she got into it, she quickly became frustrated. I dismissed her frustration as the expression of a standard learning curve, and would help her overcome particularly sticky spots now and again when I had the time. Never having used R myself, but hearing so much about it my curiosity was piqued. After I finished what I’d most urgently been trying to complete: I started to till into spatial mapping with R; to lend a hand.
Having made it this far what I’ve learned is that:
- R is a quagmire of unintuitive arguments and functions that don’t operate in any uniform or expected way. There is no idiomatic R.
- These unpredictable functions with any number of arbitrary arguments in whatever format are actually altogether poorly documented. The most practical way to get answers on obscure problems is to search mailing lists, or stackoverflow.
- R is not inherently good with resources: big datasets will consume enough to slow down everything your doing
- R is not fast:1 there is often nothing to gain from having multiple processors – R Base is not threaded (you can add packages, and will it to be so: parallel, multicore, etc). Providing software for parallel or high performance computing (HPC) with R was not a development goal2, but rather something that it was born into.
Nevertheless, by the time you’ve fully realized the drawbacks: you’ll be so far into your first project with R that you can’t turn back. You’ll proceed diligently to cobble together your own little [fiefdom / house of cards / specific selection of tools] to do exactly what you want – and nothing else.
And it’s just about then that you come back to: hey – this R thing is happening.
geospatial mapping in R
She had given me some shapefiles, and I quickly figured out I could load shapefiles from the web (GADM) simple enough
#load map from GADM
load_iceland=function() {
  #setup connection iceland map
  if (!("iM" %in% ls())) {
    con <- url(
      "http://www.filefactory.com/file/6dhsa8xf9mpz/n/ISL_adm2_RData")
  }
  #load map from GADM
  # NOTE: if variable name changes, and this function
  # no longer works print(load(con)) to find new variable name
  load(con)
  close(con)
  return(gadm)
}
and plot them using spplot(), part of the sp package. I could even overlay them (by way of spplot()+spplot()) if I used another package latticeExtra.
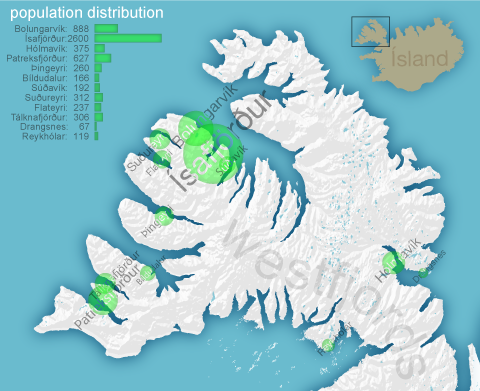
Then I got that bug that everyone gets – I want [more / better] data. Fortunately (or not) I was able to find it. I found more detailed coastline and demographic shapefiles from OpenStreetMap.org via the OpenStreetMap package (credit to this guy), and then ?.dem files from the Advanced Spaceborn Thermal Emission and Reflection Radiometer (ASTER) a Japanese device on the Terra Satellite.
It was about this time that I discovered rgdal (a set of bindings in R for the Geospatial Data Abstraction Library GDAL). To load rgdal, first you have to build GDAL – which is a tool external to R that allows the manipulation of “raster geospatial datasets”, like ?.dem files. GDAL in and of itself turned out to be an enormously useful tool for manipulation of the data external to R. Once I thought I had something pretty swell I’d load it up:
if (!("iWater" %in% ls()) && LOAD_FULL) {
  iWater <- readOGR(dsn="./iceland_shapefiles", layer="iceland_water")
}
if (!("iCoast" %in% ls()) && LOAD_FULL) {
  iCoast <- readOGR(dsn="./iceland_shapefiles", layer="iceland_coastline")
}
if (!("iEle" %in% ls()) && LOAD_FULL ){
  iEle <- readOGR(dsn="./iceland_shapefiles", layer="iceland_elevation")
  iEle$uniform <- as.factor(rep(c(1), length(iEle$elev)))
}
which is pretty straight forward but for the last line there where I create a column in iEle (uniform) that lets me plot all the elevation lines as one color (as all the rows have the same value==1). If the variables are already in the workspace, I don’t load them, and if I want to force them to not load I toggle LOAD_FULL. Loading this data set takes a noticeable few seconds.
I fooled around for quite some time with plotting rasterized spatial data in R, and none of it came off all that pretty. I never really got that right.
But once you do get something right, you’re going to want to export it in a way that’ll look pretty on your webpage – or in a word file, or (heavens forbid) a PowerPoint presentation, etc. The best way to export plots from R is in a vectorized format (as apposed to raster) such as SVG, or PDF. In these formats the display device will be able to recreate the figure dynamically at whatever resolution is required because the file specifies shapes, instead of pixels.
But you knew that.
So I proceeded to export my whole new nifty stack of spatial plots to a PDF. Popping it open I was sort of unsurprised to find that the layers I’d constructed with the use of latticeExtra weren’t preserved. So I googled aimlessly on, and eventually found the following exchange:
Dear all, Is it possible to create a pdf file with layers using the pdf() device in R? Many thanks for your help!
-n00b: Christoph
No. Is it possible to specify layers in the R graphics language or any device? (From what I understand by ‘layers’, no.)
-humbly: The author of pdf()
This is (I have found) a pretty standard open source guru-type response: the “it’s not a bug – it’s a feature” response. Nothing is more infuriating. What it really means is one of the following in order of ascending likelihood:
- I have no interest in implementing that feature for you.
- I have no idea how to do that, but I’m not going to admit that to you.
- I have no interest in even trying to figure out if I know how to do that (ie I have too much else to do to get to that)
Quite sure there was no solution in the works, nor would anyone with more experience or insight pursue such nonsense: I got on it directly.
Layers in pdf()? easy-peasy.
anatomy
pdf() is implemented as what I would eventually come to interpret as an extension. There’s a R function that references a quick one-off C library that implements an interface to the graphical device library. It’s a quazi API for graphical devices, but it’s purely sequential – and omits what could have been executed more intuitively by passing a XML-like tree object. They went they way they did for the reasons they had at the time, but it makes implementing the interface a bit like trying to make a finger-painting while your hand is asleep.
Whatever comes out of the interface has to be dealt with, and even within the calling structure there are arbitrary attempts to clean up repetitive output. But this is that sort of thing where you get the repetitive output anyway. It’s mucked up so well that you can’t even tell what you’re supposed to be able to dismiss.
Anyhow, the implementation of pdf() works well enough. Many of the essential objects and their dictionaries are actually statically assigned ids and so forth – which tumbles things around again in a sort of bothersome way, but alas – I succeeded. PDF layers (as per the ISO 32000-1 specification) are implemented as “Optional Content Groups”. I finagled a way within the scope of the original implementation to shuffle the tags and objects into a suitable conformation. Took me a bit longer than I would have expected (as I should have expected) as certain dictionaries that were marked ‘optional’ in the spec absolutely weren’t.
In the midst of wrestling with this I found a simple, free (favorite kind) tool that helped me greatly:
- PDF Object Browser by canoo : A java webstart type application that lets you browse a PDF tree. The Canoo webisite has since been completely re-done, and the original link to the page for the applicaiton no longer works. For now though, (by downloading and running the file via the provided link) it seems the application is still available with an expired security certificate. It was good while it lasted.
then I tested it.
The layering I’d implemented into pdf() seemed to work with readers like Adobe Acrobat, and Ubuntu’s default Document Viewer – but not with the CS5 suite I had access too. I was gunning for layers not because I wanted to print PDFs with optional layers (although that’s nice), but I wanted PDFs that I could load into Illustrator (Ai) and have all the objects for each figure organized by layer. Then I could do wonderful-cool things like join all the segments that described the coastline and create clipping layers and shadow effects… really useful and practical stuff!

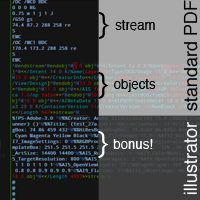
It turned out, I was exactly half way to nowhere. Ai and the other Adobe CS5 products are stubbornly and knowingly not complaint to the PDF specification: they don’t honor Optional content as layers. Instead, as I would learn, when you build layers in Ai, and then save to a PDF – the PDF specification is so pliant to an excess of data within the structure that they embed an Illustrator ?.ai file right there within it. Wikipedia refers to it as a dual-path approach. Awesome. Why write one file, when you can write two, one within another?! As far as I could figure out it’s a compressed postscript format that at one time was probably the grandfather of the PDF format itself.
There was no way I was going to convince the sloppy little pdf() to write a format I had no formal description of.
At this point I sadly tried to do something with ?.svg, but – very sad. Not even workable.

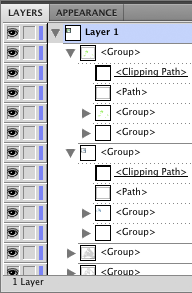
Then I had an epiphany: I realized that Ai had to honor clipping layers. In order to create a clipping layer you need two objects (an object to clip, and an object to specify the clipping) and in Illustrator those objects have to be grouped. pdf() was hierarchy agnostic up and to this point – every clipping layer was promptly created, and then closed as soon as possible to retain a constant object depth. Sometimes it would try to exit a dozen times or so – sometimes it would create the clipping layers multiple times over: once with something necessary inside, the next time with nothing. It was all rather noisy – but fortunately it had no care for the depth of the tree – it always wanted to be creating at the root.
So I tricked it – every time I open an Optional Content group I bump the tree up one layer, and every time I leave a group I bump down one. I force the clip at the media size to so it has absolutely no effect on the content.
end
top
what to expect
Adobe CS# products load the new layers from pdf() as superfluous clipping groups. They’re unnecessary, but the objects being grouped within them makes it easy enough to reorganize the content to the intended state within 2 minutes. Otherwise, in viewers such as Acrobat and Document Viewer (in Ubuntu) the layers will just load up naturally: as layers. I haven’t set it up so you can appropriately name the layers, but that could be done if I get a sense that people are really that excited about it.

usage
All I can provide right now is a patch for (2.16.0 Unsuffered Consequences). If you know what to do with that: good on you (you have to download the R source, patch it, build it, and install it). If you know what you’re doing it’s not all that difficult, if you don’t – maybe throw some comments down below so we can help everyone out – so I know where people commonly have problems.. (if you’re that motivated). I’ve used it on 32 and 64 bit linux machines – I doubt that it will work much differently on any other architecture. Nothing I changed was architecture specific, but what I’m not sure of is if there are other PDF engines in there. The extension that I edited was a rudimentary reinvent-the-wheel type of deal, and I was surprised to find that it wasn’t just a library. Some systems may load a library(?) if it’s available at compile time – maybe I just didn’t have that configured. I don’t really know – I’m not overly familiar with the grDevices available in R, I just thought I’d hack this together and see if it made a stir. If it does and there’s legitimate interest in putting it into the next release – well, we’ll just figure that out as it comes.
Pretty straight forward to use:
pdf("file/name",onepage=TRUE)
[ PLOT STUFF ]
dev.off()
It won’t much like you if you try to set the version < 1.5 (optional content is only valid 1.5 and after), nor if you try to set onefile=FALSE at the same time. Otherwise it doesn’t bite.
2 M. Schmidberger, M. Morgan, D. Eddelbuettel, H. Yu, L. Tierney, U. Mansmann (2009) “State of the Art in Parallel Computing with R” Journal of Statistical Software